Quantitative EEG in dementia investigations
|
EEG means electrical brain imaging and this is done with electrodes which are in electrical contact with the scalp. Thus "listens" to electric potentials from the underlying gray matter neurons near the electrodes. The electrodes are arranged according to a system (10-20 system) in order to cover the various regions of brain areas that are close to the scalp. These electrodes are usually 19 in number and the activity they record will not come only from the immediate underlying nerve cells, but also from the nearby areas. Approximately, the scanning activity in a field surronding the electrode with maximum strength directly below the electrode. A single neuron discharges is far to weak to record in this way, despite the powerful amplifier that can pick up single m In fact, a large number of nerve cells discharged at the same time, where their weak discharges is added so that it can be detected by EEG-equipment (electrodes and amplifiers). For this to happen, there are links within the gray matter between nerve cells that enables them to link up and discharge at the same time. There are also groups of nerve cells deep in the brain (Thalamus) that can affect and control discharges in large areas of the brain via nerve fibres that reach the neurons in the gray matter simultaneously (non-specific projection fibres). Thus, the activity is coordinated in parts of the brain so that a sufficient number of neurons discharge at the same time and their joint activity can be recorded (synchronization). This ensures that the injuries, disease processes within the gray substance and also deeper located brain structure that transmits synchronized signals can be read out via the EEG. With modern computer technology, these neuron signals can be interpreted in a much better and more objective manner than before with the conventional EEG analysis. The digital technology allows to map activity in the gray matter of a particular brain activity that can be calculated in different ways; amplitude calculation (discharges strength), frequency calculation and degree of synchronization. This assessments used in dementia analysis. Here below exemplified how these variables described in normal brain activity and changed by different dementias.
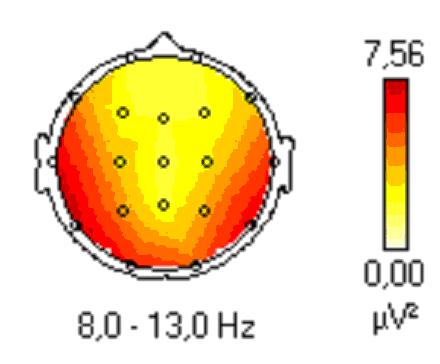
Normal Brain activityThis image shows the areas of the brain's surface seen from above where the nose pointing up. Under normal waking states dominate the so-called Alpha-rhythm (8-13 Hz) in the posterior Brain regions (the occipital region) this visualized with red color (high activity red, low activity yellow-white).
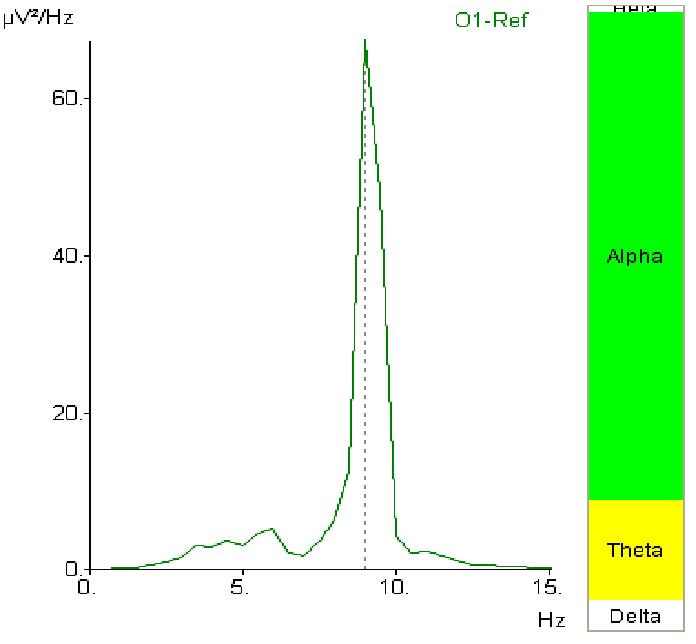
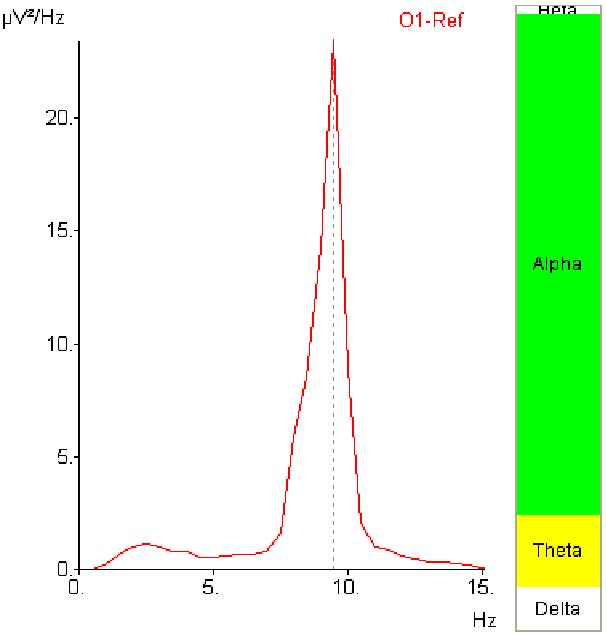
When the frequency distribution of this basic rhythm (Alpha-rhythm) is analyzed, it is possible to determine if it is within the normal frequency range.
In the picture above x-axis (horizontal) represents frequency and Y axis (vertical) amount of the different frequencies. The peak marked with a dashed line, showing the most abundant frequency, 9 Hz (normally 8-13 Hz). The vertical bar to right shows the distribution of frequency bands, green 8-13 Hz (normal Alpha-rhythm) and yellow slower waves within 8-4 Hz range. Normal is that the green color of the bar shall dominate.
Dementia of the Alzheimer type
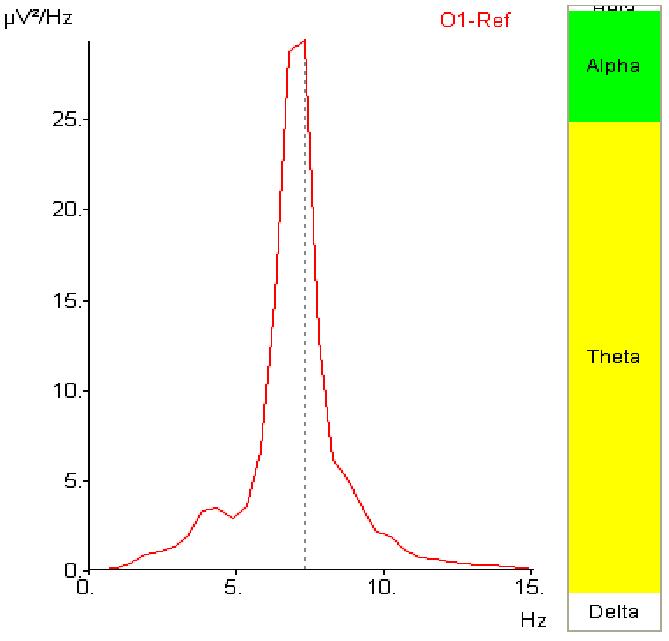
The difference in prevalence of Alpha rhythm (8-13 Hz) at Alzheimer's dementia is that the pathological changes of the brain affects and lowers the Alpha frequency so that the amount of slowly frequencies increase. This can be easily shown on the frequency distribution analysis below.
Above shown as lower peak frequency (dotted line) this means that a greater proportion of slow oscillating neurons increases: the green part (8-13 Hz) in the bar to the right, decreases and the slower yellow (4-8 Hz Theta rhythm) is gaining share and dominates in the bar.
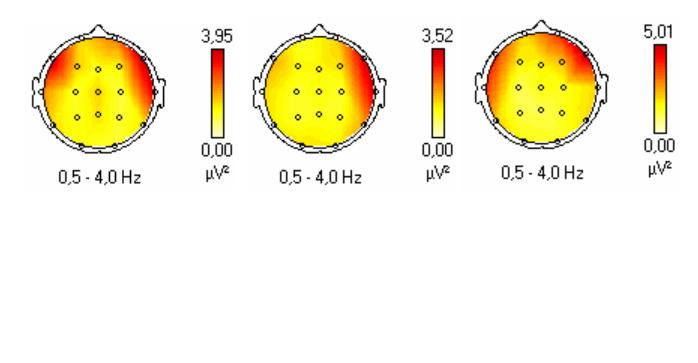
Dementia of vascular originInadequate blood flow and damage depending by blood clots to the brain can also give dementia. Inadequate blood flow and hypoxia produce slow waves in the areas that are affected. In permanent damage, in the area affected. Insufficient blood flow produces episodes of slow waves with varying location and distribution within the regions that are most affected, believed to be caused by compensatory blood flow mechanisms of communicating arterial vessels (Circulus Villis).
Illustrations above in different sequences during the same investigation showing the shifting pattern of the slow waves (0.5 to 4 Hz Delta rhythm) in the areas affected by blood flow deficiency. When the frequency distribution analyzed in the posterior brain area, a normal frequency distribution is seen and no blending of slow waves, see below.
SummaryWith these relatively simple quantitative EEG analysis, it can can easily evaluate normal and pathological dementia electric brain activity and d istinguish different dementia disorders such as Alzheimer's and vascular caused. Ongoing research and development in order to be able to distinguish other dementias such as Lewy-body dementia, Fronto-temporal dementia with this technique as well as with other methods of analysis.
|