Hyper-synchronized Gamma (γ)-frequency EEG-responses to
electrical stimulation during Electroconvulsive Treatment
| To be presented at "Towards a science of consciousness" conference April 2012 Tucson Arizona by Rolf Ekedahl M.D., Ph.D. Clinical Neurophysiology NeuFyDi AB, Stockholm, Sweden.
Introduction Since anaesthesia and muscle blockade with assisted ventilation was introduced during ECT it has become even more important to monitor the cerebral electrical events. The commonly used anaesthetics have a strong antiepileptic effect, and therefore these anaesthetics will to some often unknown extent, counteract the induced epileptically activity with the purpose of triggering a generalized epileptically grand mal seizure. The electrical stimulation devices commonly used Thymatron® (Somatics Lcc) and MECTA® (MECTA corp.), have a simplified EEG-monitoring system, which record and evaluate the EEG-activity from one channel after the actual electrical stimulation. The filter settings (< 6Hz) restricts it to monitor the low frequency response from the epileptically seizure activity, namely the inhibitory activity. In addition, the recording electrodes are located just above subdermal muscles and this low frequency muscle activity can contribute to the recorded signal.
Objective We wanted to ensure recordings of the epileptically activity, also the high-frequency components throughout the whole ECT-session including the electrical stimulation sequence and to reduce potential artefacts.
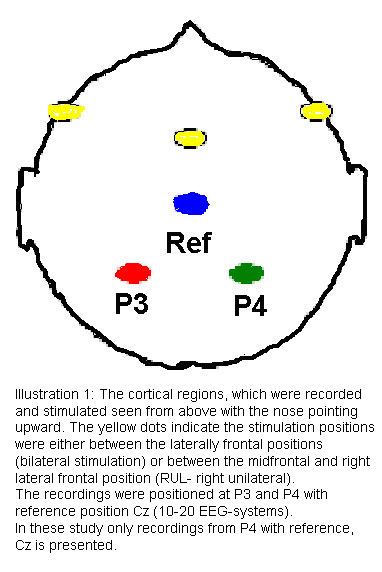
Method The electrical stimulation at the ECT sessions were according to standard procedure either with a bifrontal or RUL (right unilateral) frontal stimulation (illustration 1), the stimulation device , Thymatron®, delivered square pulses with 0,25 -1 ms (4000-1000 Hz) and with a stimulus pulse interval between 40-140 Hz. In order to avoid the pitfalls described above with the monitoring technique alternative recording positions were chosen namely P3, P4 and the reference position CZ used in the 10-20 system for EEG. These positions were chosen to avoid closeness to underlying subdermal muscle activity and to ensure recordings during the stimulation.
Illustration 1: The cortical regions, which were recorded and stimulated seen from above with the nose pointing upward. The yellow dots indicate the stimulation positions were either between the laterally frontal positions (bilateral stimulation) or between the midfrontal and right lateral frontal position (RUL- right unilateral). The recordings were positioned at P3 and P4 with reference position Cz (10-20 EEG-systems). In these study only recordings from P4 with reference, Cz is presented.
The digital EEG-system Nervus 5.3 (Viasys Healthcare™) was used for recording and analyzing the recorded EEG. The digital amplifier had a sampling frequency of 128 Hz, the digital filters used were set to 5 Hz low-cut and off fore high-cut, and a notch filter set at 50 Hz.
The frequency was analysed for the recorded signal throughout the stimulus at the P4 site using Cz as reference. The obtained frequency patterns were further analysed and divided in to two frequency bands, low-high frequency between 5 and 30 Hz (α and β EEG-frequencies) and high frequency from 30 Hz (γ EEG-frequency) up to 100 Hz. According to the percentage of gamma (γ-activity (30-100 Hz, 50 notch filtered), the individual ECT-sessions were plotted and correlated to the frequency pattern.
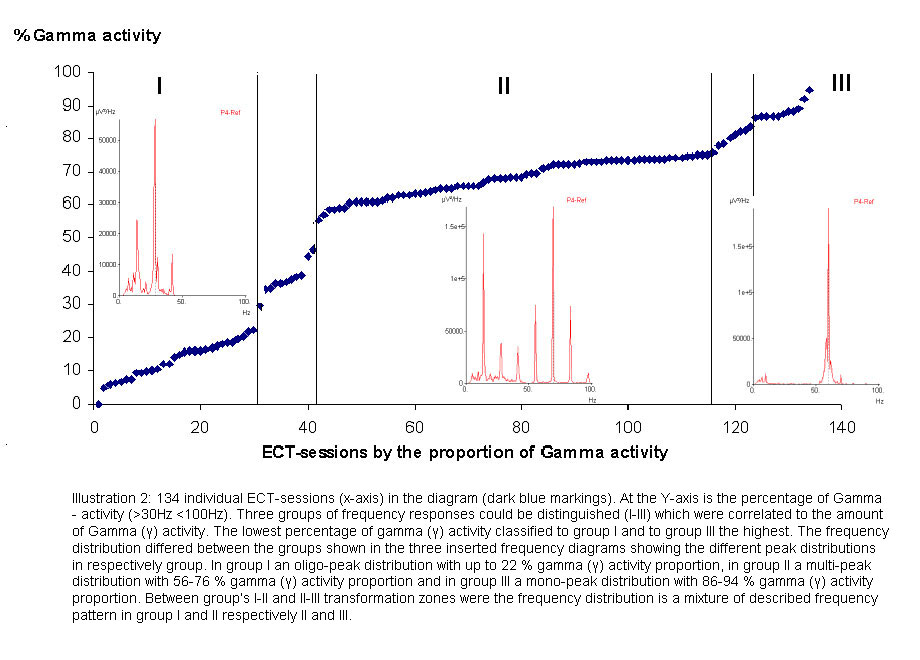
Illustration 2: 134 individual ECT-sessions (x-axis) in the diagram (dark blue markings). At the Y-axis is the percentage of Gamma- activity (>30Hz <100Hz). Three groups of frequency responses could be distinguished (I-III) which were correlated to the amount of Gamma (γ) activity. The lowest percentage of gamma (γ) activity classified to group I and to group III the highest. The frequency distribution differed between the groups shown in the three inserted frequency diagrams showing the different peak distributions in respectively group. In group I an oligo-peak distribution with up to 22 % gamma (γ) activity proportion, in group II a multi-peak distribution with 56-76 % gamma (γ) activity proportion and in group III a mono-peak distribution with 86-94 % gamma (γ) activity proportion. Between group’s I-II and II-III transformation zones were the frequency distribution is a mixture of described frequency pattern in group I and II respectively II and III.
Results The analyzes of the 134 individual ECT-sessions showed a varying frequency pattern and also a much varying content of gamma (γ) activity varying from 5-94 % percentage proportion (illustration 2). There were not a stereotyped generalized epileptically activity which could have been expected. According to the different frequency patterns and content of gamma activity the resulting responses were subdivided into three different groups here called I-III. The first group I showed an oligo-peak frequency distribution with well distinguished peaks at 13,7 and 28,3 Hz and a gamma (γ)-activity proportion of 0-22 %. 29/134 (22%) of the ECT-sessions were classified to this first group and the proportion of gamma-activity were 5-22 %. The second group II showed a multi-peak frequency distribution with peaks at regular intervals between 13,7-95,5 Hz (illustration 2). 74/134 (55%) ECT-sessions were classified to group II and the proportion of gamma-activity was 56-76 %. The third group III showed a splintered mono-peak distribution, with a dominating frequency around 60 Hz. 10/134 (7%) of the ECT-session was classified to group III and the proportion of gamma-activity was between 86-94 %. Separating group I-II and II-III were transformation zones (illustration 2) were the frequency distribution showed intermediate frequency distributions patterns between group I and II respectively II and III. The amplitude for the peaks had high amplitudes compared to normal EEG-amplitudes (<100 μV) and the highest in group III with approximately 1000 μV.
Discussion Technical aspects: An other potential source for artefacts was from the stimulus pulse. The stimulus-pulse could be set to 0,25-1 ms pulse length, expressed in frequencies between 1000-4000 Hz for the Thymatron stimulus device used in this study, which are well above the 128 Hz sampling frequency for the recording system and would not contribute to the recorded activity. To avoid unwanted muscle activity the recording position was positioned at the Parietal region, P3, P4 and Cz (10-20 EEG-system) There are no underlying subdermal muscles in that area.
Clinical aspekts: Another clinical interesting observation is the graded responses to stimulation seen during the stimulation and if that can be used as a method to predict if a stimulation have had a satisfying effect for the result of the treatment. Neurophysiological aspects: In a majority of the responses a high amplitude hyper-synchronized gamma (γ)-activity was triggered from the frontal stimulation position and recorded at a distant parietal position. Most probably, this is a transmitted activity via Cortico-Cortico connections, Cortico-Thalamic pathways or association pathways. No firm conclusions on this issue can be drawn from this study, but some observations shows different responses in the left parietal region compared to the right and a time lag between these responses (inter-hemispheric pathways?). As the stimulation does not reflect a normal brain activity the relation to normal neurophysiologic processes is uncertain e.g. the transient moving gamma (γ)-activity suggested by Professor Stuart Hameroff as a basis for conscious cognitive neurocomputation (The “consciousness pilot”-dendritic synchrony moves through the brain to mediate consciousness. Stuart Hameroff., Journal of Biological Physics Vol. 36 nr. 1. 2010 Springer). However at least a neuronal basis for hyper-synchronized gamma (γ)-activity which can be transmitted have been shown by these observations.
Summary A graded response to the frontal electrical stimulation position during ECT-sessions can be recorded in surface EEG at a distant parietal site. The responses trigger a hyper-synchronized gamma (γ)-activity in a majority of the sessions. This observation might offer a new and improved monitoring technique for ECT and raises questions of this hyper-synchronized gamma (γ)-activity plays a role for the treatment effect. Furthermore, it demonstrates a neuronal basis for transmission of hyper-synchronized gamma (γ)-activity in cortex. |